
Estimated Reading Time: 5 min
“New to crypto trading? Learn the basics of cryptocurrency trading, essential strategies, risk management, and the best platforms to start your journey today!”
Cryptocurrency trading involves buying and selling digital assets like Bitcoin, Ethereum, and other altcoins to make a profit. Here’s a structured guide to get you started:
1. Understanding the Basics
What is Crypto Trading?
Crypto trading is the process of exchanging cryptocurrencies through online platforms (exchanges) with the goal of making a profit.

Types of Crypto Trading
- Spot Trading – Buying and selling assets for immediate delivery.
- Futures Trading – Trading contracts that agree to buy/sell crypto at a future date.
- Margin Trading – Borrowing funds to trade larger positions with leverage.
- Day Trading – Making multiple trades within a single day.
- Swing Trading – Holding assets for days or weeks to capitalize on price swings.
- HODLing (Long-term Investing) – Holding assets for an extended period, hoping for price appreciation.
2. Choosing a Trading Platform
Here are some of the most popular crypto exchanges:
- Binance (Best for futures and spot trading)
- Coinbase (Beginner-friendly)
- Kraken (Good for security)
- Bybit (Best for derivatives)
- KuCoin (Good for altcoins)
Things to consider:
- ✔️ Security
- ✔️ Trading fees
- ✔️ Available trading pairs
- ✔️ Liquidity
3. Fundamental & Technical Analysis
Fundamental Analysis (FA)
- Research the project (Whitepaper, team, use case).
- Look at market trends and news.
- Consider adoption rate and partnerships.
Technical Analysis (TA)
- Candlestick Charts – Shows price movement.
- Support & Resistance – Key price levels where buyers or sellers step in.
- Indicators:
- Moving Averages (MA) – Shows trend direction.
- Relative Strength Index (RSI) – Measures market momentum.
- MACD (Moving Average Convergence Divergence) – Indicates trend strength.
- Bollinger Bands – Shows volatility.
4. Risk Management Strategies
- Never invest more than you can afford to lose.
- Use Stop-Loss Orders – Automatically exits a losing trade.
- Diversify Portfolio – Don’t put all your money into one crypto.
- Risk-Reward Ratio – Aim for a risk-to-reward ratio of at least 1:2.
- Stay Updated – Follow market news and global trends.
5. Trading Strategies
Scalping – Taking small profits multiple times a day.
Breakout Trading – Buying when the price breaks above resistance.
Trend Following – Trading in the direction of the trend.
Mean Reversion – Buying when an asset is oversold.
6. How to Place a Trade (Example on Binance)
- Create an account on a crypto exchange.
- Deposit funds (USDT, BTC, or fiat).
- Choose a trading pair (e.g., BTC/USDT).
- Select an order type:
- Market Order (Instant buy/sell at market price)
- Limit Order (Buy/sell at a specific price)
- Stop-Loss Order (Sell when the price drops to a set level)
- Execute the trade and monitor.

7. Trading Tools & Resources
- TradingView – For chart analysis.
- CoinMarketCap – For market data.
- Glassnode – For on-chain analytics.
- Crypto News Sites – CoinTelegraph, Decrypt, CoinDesk.
8. Common Mistakes to Avoid
- ❌ Trading with emotions (Fear & greed)
- ❌ Ignoring risk management
- ❌ Overleveraging in futures
- ❌ Chasing pumps (FOMO)
- ❌ Not having a trading plan
9. Learning & Practicing
- Start with a demo account on Binance or Bybit.
- Backtest strategies using historical data.
- Join crypto communities (Twitter, Discord, Telegram).
- Keep a trading journal to track performance.
10. Detailed Chart aAnalysis
I’ll provide a detailed chart analysis using Bitcoin (BTC/USDT) as an example. I’ll include support/resistance levels, trend analysis, and key indicators like RSI, MACD, and Bollinger Bands.
📊 Bitcoin (BTC) Technical Analysis
🔹 Support & Resistance Levels
- Support: $90,000, $85,000
- Resistance: $105,000, $110,000
📈 Market Trend
Bitcoin is currently consolidating between $90,000 – $110,000. A breakout beyond these levels with strong volume could determine the next big move.
📊 Key Indicators
- RSI (Relative Strength Index): 43.74% (Neutral)
- MACD (Moving Average Convergence Divergence): Bearish momentum
- 50-day & 200-day Moving Averages: Bullish trend
📉 Chart Patterns
Bitcoin recently formed a potential Double Top around $106,000, which suggests possible bearish pressure.
🔍 Market Sentiment
- ✔️ Bullish: Pro-crypto regulations and institutional adoption.
- ❌ Bearish: Recent U.S. tariffs raising inflation concerns.
📢 Final Thoughts
Traders should keep an eye on Bitcoin’s $90,000 support and $110,000 resistance. A breakout could confirm the next major trend. 🚀
🔗 Share This Analysis
🐦 Share on Twitter | 📘 Share on Facebook
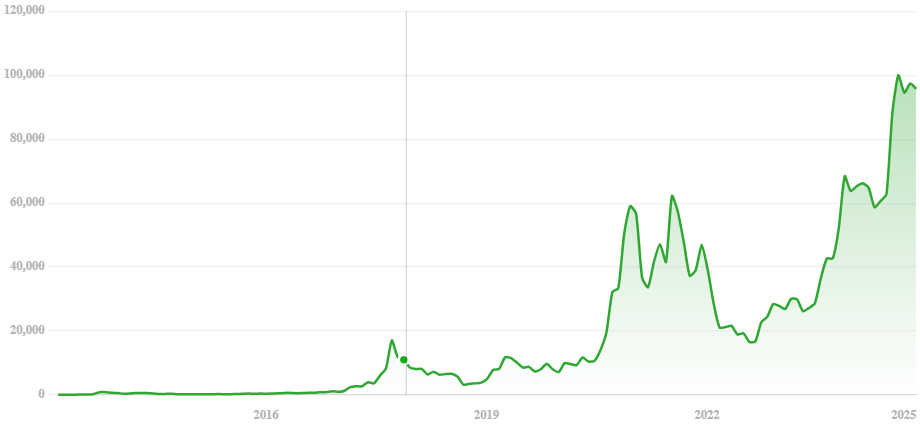
As of February 12, 2025, Bitcoin (BTC) is trading at approximately $96,170, reflecting a 2.24% decrease from the previous close.
Recent Price Movements:
- All-Time High: On January 15, 2025, BTC reached a new all-time high of $109,588.
- Recent Correction: Following this peak, the price corrected by approximately 16.5%, reaching a low of $91,231.
Support and Resistance Levels:
- Support:
- $90,000: BTC has tested this level multiple times, indicating strong support.
- $85,000: Serves as a secondary support level.
- Resistance:
- $105,000 to $110,000: This zone has acted as significant resistance recently.
Technical Indicators:
- Moving Averages:
- The 50-day and 200-day moving averages are both trending upwards, suggesting a bullish medium to long-term outlook.
- Relative Strength Index (RSI):
- The 14-day RSI is at 43.74%, indicating neutral momentum.
- MACD:
- The MACD oscillator shows a value of -3,173.94, suggesting bearish momentum in the short term.
Chart Patterns:
- Double Top Formation: Between December 2024 and January 2025, BTC formed a potential double top around $106,000, indicating a possible bearish reversal.
Market Sentiment:
- Bullish Factors:
- Pro-crypto policies from the current U.S. administration have bolstered market optimism.
- Analysts predict BTC could reach between $146,000 and $212,500 in this cycle.
- Bearish Factors:
- Recent U.S. tariffs on imports have raised concerns about inflation, potentially impacting BTC negatively.
Conclusion:
Bitcoin is currently consolidating between $90,000 and $110,000. A decisive move beyond this range, accompanied by significant volume, will likely determine the next major trend. Traders should monitor these key levels and indicators closely to inform their strategies.